Build Custom Dashboards with OfficeRnD Analytics

4 mins read Published: Oct 11, 2021 Last updated: Jul 31, 2026
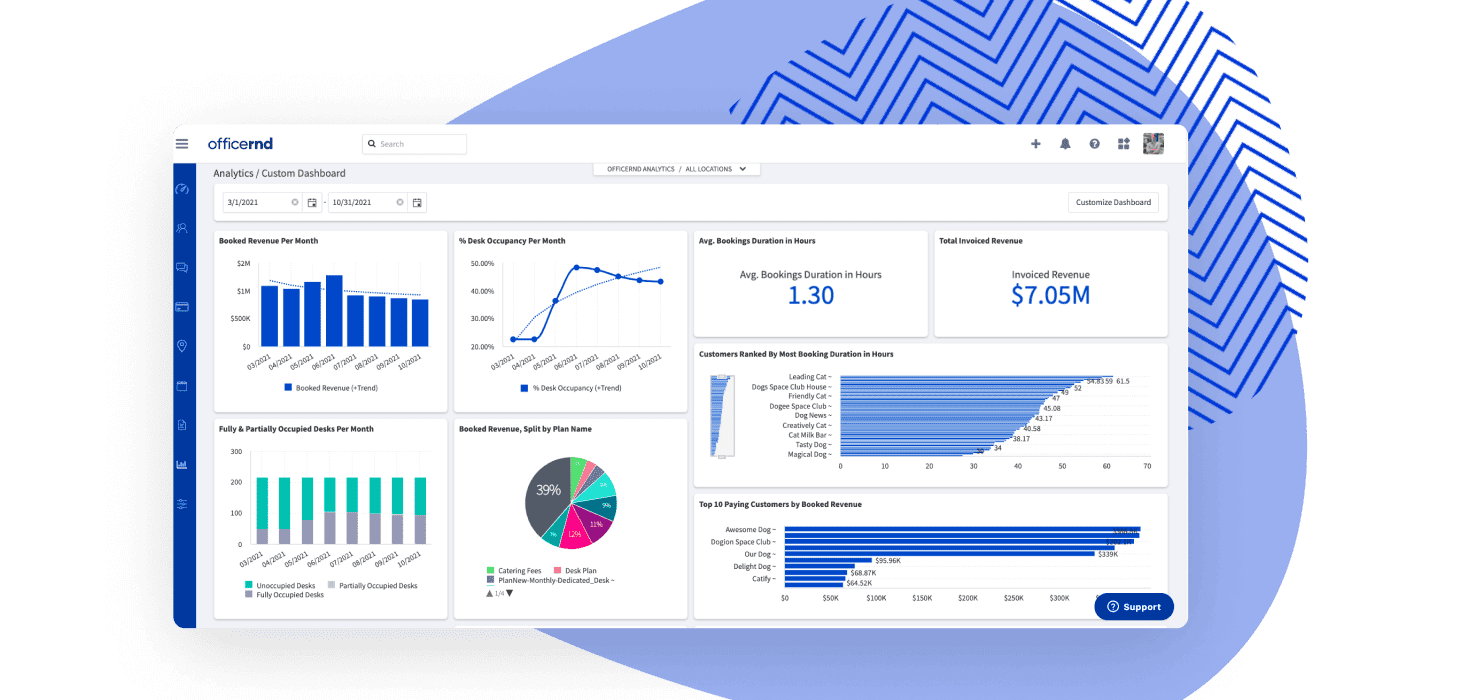
Flex space operators need data to make better decisions. They need reporting that fits how a modern workspace actually runs, and they need to get to it without hours of manual work, so the team can spend less time building reports and more time looking after members.

Analytics in OfficeRnD Flex gives coworking and flex space operators one place to track revenue, occupancy, bookings, and utilization, then build the exact views their business needs. Since the first release we’ve spoken to operators who put that data to work in their organizations and are already seeing the results.
Custom dashboards let you shape those reports around the questions you’re actually asking. Here’s how they work, what you can build, and where the analytics in OfficeRnD Flex is headed.
Custom dashboards let operators assemble their own reports by dragging widgets onto a page, so you see the metrics that matter to your role or your team in one view. You’re not limited to a single fixed report. You build the ones you need.

Personal and team custom dashboards give you multiple dashboards, each tailored to an individual or to the whole organization.
Organizational dashboards are visible company wide and work well for weekly review meetings where the team walks through key metrics together. Personal dashboards belong to one user, focused on the data that’s critical to their role.

The visual widget library makes building a dashboard quicker. As you pick widgets, a panel shows how each one looks on the dashboard and gives a short description, so you know what you’re adding before you add it.

You can choose from a library of 100+ pre-made widgets covering contracts, visitors, marketplace orders, payments, events, users, logins, and more. If something’s missing, the team adds new widgets regularly. That range lets operators drill into a specific part of the business and get a clearer picture of how it’s performing.
Custom dashboards were an early step. Since then, the analytics experience in OfficeRnD Flex has grown into Data Hub, a data platform and business intelligence tool for flex operators. Data Hub gives your team ready-to-use dashboards tracking revenue, traffic, occupancy, bookings, and utilization, so you spend more time deciding and less time building reports.
A few things worth knowing about the current experience:
The FlexIndex is worth a closer look if you want to know how you stack up. It’s a composite index that aggregates anonymized data from over 3,000 spaces, tracking five core KPIs: total revenue, overall occupancy, desk occupancy, revenue per available desk (RevPAD), and revenue per occupied desk (RevPOD). You can compare your performance against regional and global benchmarks without leaving the platform.
OfficeRnD Analytics is a complete data, analytics, and insights solution for the flexible working industry, and the roadmap keeps growing.
We share product updates like these at our industry event, FlexWorld. Join us to hear from industry experts about the future of flexible and hybrid work, and to see what’s next in OfficeRnD Flex.
A custom dashboard is a report you build yourself by dragging widgets onto a page, so you see the KPIs relevant to your role or team in one view. You can create personal dashboards for one user and organizational dashboards shared across the whole company.
Through pre-built and custom dashboards, you can track revenue, occupancy, bookings, utilization, contracts, visitors, marketplace orders, payments, events, users, and logins, among others. Data Hub also lets you export reports in PDF and CSV and filter them by date, location, and resource.
Yes. OfficeRnD Data Hub can send automated email reports to staff, so everyone stays current on key metrics without opening the platform.
Use the OfficeRnD FlexIndex. It aggregates anonymized data from over 3,000 spaces and tracks five KPIs (total revenue, overall occupancy, desk occupancy, RevPAD, and RevPOD) so you can compare your performance against regional and global benchmarks.


OfficeRnD Workplace vs Envoy on pricing, features, and real G2 reviews.
The OfficeRnD AI Sales Agent now works in your website chat. Learn more.
We tested and compared the best hybrid work software of 2026. Read on.
Pricing, features, and real reviews compared, so you can pick the right desk booking software.
These are the most expected hybrid work trends for 2026 and beyond. Read on!
See how Yarooms compares to OfficeRnD Workplace and who wins.