What a Year of Our Own Hybrid Work Data Actually Showed Us

6 mins read Published: Sep 28, 2026 Last updated: Sep 28, 2026
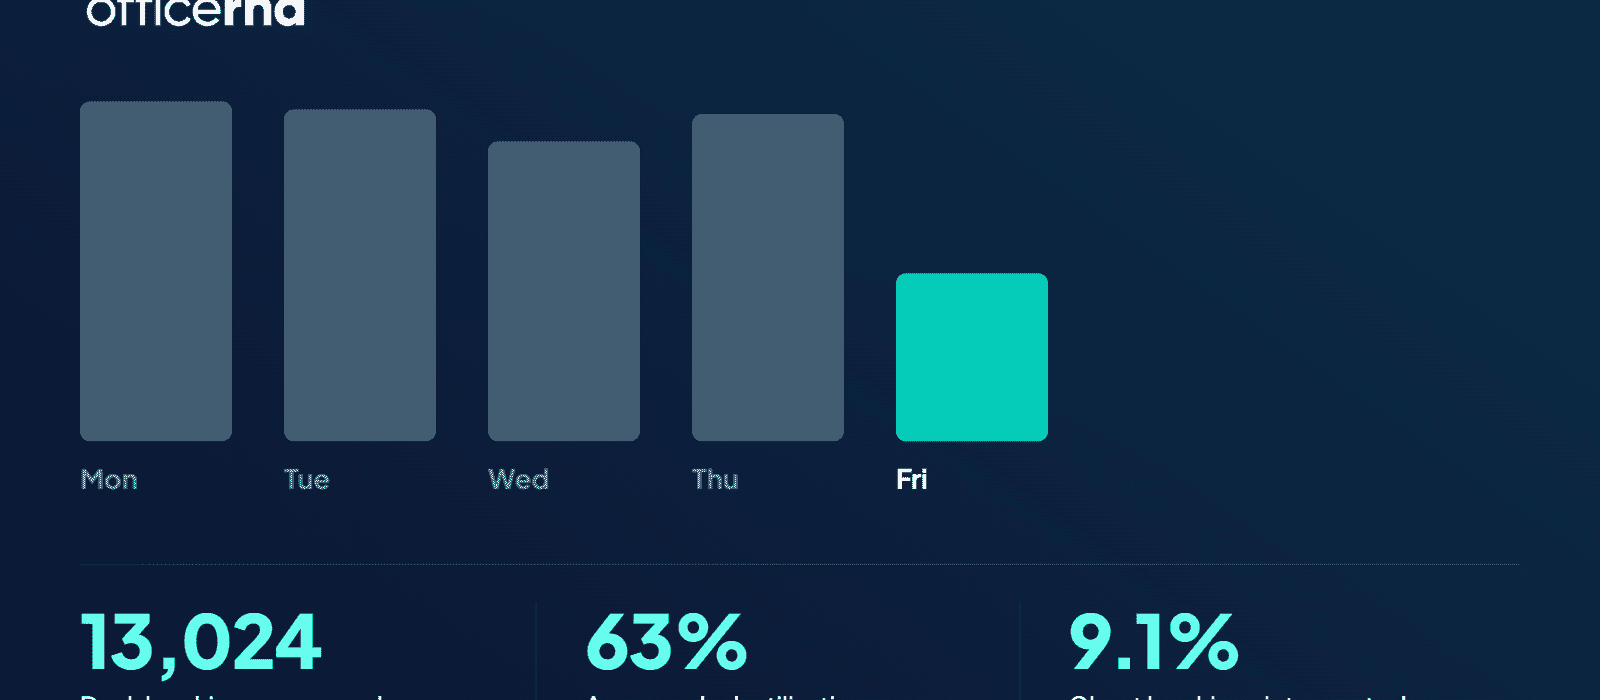
TL;DR:
This is our story – what 13,024 bookings, 365 days, and one office move look like in real life.
Most hybrid work research asks people what they do. We wanted to know what our team actually did, which is a different question and often a different answer. Here’s what we found.
On a typical working day, our office runs at 63% desk utilization. That sounds like a manageable, well-sized office with room to spare. But in fact, it isn’t, and the daily numbers explain why. Our busiest day runs at roughly double our quietest one. Nearly one working day in five pushes past 80%, and the busiest days of the year hit capacity exactly. The average sits in a gap that almost none of our actual days occupy – the full weekday breakdown is in the report.
If our office was sized for 63% attendance, it would be under real pressure at the start of every week and half-empty every Friday. If your desk ratio comes from an average, you might face issues when utilizing it. We actually worked on a calculator that can help you size your new office if you plan a move. Check it out here.
Our hybrid work policy asks for eight office days a month. Against a typical 21 working days, that’s a floor of roughly 40%.
Most of the week runs well clear of that floor. Friday sits almost exactly on it.
That gap is the finding we didn’t expect. If people treated the mandate as a box to tick, they’d spread their required days evenly and thinly – minimum disruption, maximum compliance. Instead, we noticed that people pile onto the days their colleagues will be there and skip the days they won’t. How far above the floor they go, and which days carry it, is in the report.
Every desk booking in our office requires a check-in. Miss it, and the booking cancels itself, putting the desk back in the pool.
Across the year, nearly one booking in ten was auto-cancelled at check-in time. Every one of those would have been a ghost booking — a desk reserved, never used, and blocked all day — and instead our policy setting put it straight back in the pool.
In practical terms, that’s several desks recovered every single working day, on top of a much larger number released by people cancelling ahead of time – which mostly happens because they expect the system to hold them accountable. Without any of it, our reported utilization would have been inflated by phantom occupancy, and anyone hunting for a desk on a busy Tuesday would have been staring at a floor map full of empty “occupied” desks.

This is the comparison we found most interesting. Almost everywhere else, Monday is a quiet day – global occupancy data has long treated Monday and Friday as the light ends of a “barbell” week.
Ours doesn’t do that at all. It’s the busiest day of our year. Only Friday sits where the rest of the world’s bookends do.
What this means, along with data from major research, you’ll find in the full report.
We moved offices in May 2026 and added roughly 11% more desks. Utilization didn’t fall to absorb them (a typical day got busier rather than quieter), and almost all of that movement landed on one single weekday, while Friday didn’t change its attendance.
But that’s 13 weeks of data, landing squarely in summer, when our headcount also grew. We can’t separate the move from the season or the hiring, so we’ve written it up as a signal to watch rather than a finding. The report says so explicitly, along with the claims we had to throw out entirely.
The report is the version with the numbers in it:
Read the full case study, including the day-by-day breakdown, the office move analysis, the Friday paradox, and more on how you can put your data against the global findings.
Desk utilization is the share of available desks in use on a given day. If an office has 60 desks and 38 are occupied, utilization is 63%. It measures space, not people – it doesn’t tell you how many days a week any individual comes in, which is what most hybrid work surveys measure instead. People often quote them interchangeably, but they shouldn’t.
A ghost booking is a desk reserved by someone who never showed up. The desk looks occupied on the office map, so nobody else can book it, and reported utilization is inflated by space that was never used. In our office, nearly one booking in ten would have become a ghost booking without automatic check-in enforcement available in our Workplace product.
Every desk booking requires the person to check in within a set window. If they don’t, the booking cancels automatically, and the desk returns to the pool. In our office, this reclaimed roughly 8% of daily capacity from a single policy setting.
In most global occupancy data, Tuesday is the busiest day and Monday and Friday are the quietest – the so-called “barbell” week. Our office doesn’t follow that pattern: Monday is our busiest day, unlike others. Continental European teams tend to work from home fewer days compared to the US, which may be part of the explanation. Our full weekday comparison against the global benchmarks is in the case study.
Friday has the fewest scheduled meetings, so the commute is harder to justify. Our data reports Friday as the day with the highest share of recurring bookings and the one with the highest no-show rate – people who book Fridays are regulars, and they’re also the most likely to change their mind. We call it the “Friday paradox” and unpack it in the report.
Our policy requires eight office days a month, roughly a 40% on-site requirement. Actual attendance runs well above it for most of the week. The mandate explains our Fridays, which sit almost exactly on the policy’s level, and very little else – people cluster on days their colleagues are in rather than spreading required days evenly.
No. It’s one company’s office in Sofia, Bulgaria, over one year. It’s a worked example of what first-party booking data can show, not a benchmark. Our colleagues in the US, Australia, and the UK work remotely or from coworking spaces and aren’t included.
The complete weekday breakdown before and after our office move, the booking-status data behind the 8% capacity we recovered, the Friday paradox in full, how our week compares against Gallup, Stanford, Kastle, and XY Sense, and the methodology – including what we didn’t add and why.


![14 Best Space Management Software Tested and Compared [2026]](data:image/svg+xml;base64,PHN2ZyB2aWV3Qm94PSIwIDAgMTE1MiA3MTkiIHdpZHRoPSIxMTUyIiBoZWlnaHQ9IjcxOSIgeG1sbnM9Imh0dHA6Ly93d3cudzMub3JnLzIwMDAvc3ZnIj48L3N2Zz4=)
The best space management software in 2026 is OfficeRnD Workplace. This is a complete buyer's guide.

The average flex operator connects 1.65 of 5 core systems. See what the gap costs and how to fix it.
A 2-site coworking operator shares how OfficeRnD's AI Sales Agent handles inquiries.
OfficeRnD Flex vs Nexudus on pricing, features, and real G2 reviews.
OfficeRnD Workplace vs Robin, full comparison: pricing, adoption, coordination and fit

We've built helpdesk to solve a specific problem. Here it is.