Free Desk Booking Template in Excel [Plus Google Sheets]

11 mins read Published: Dec 8, 2022 Last updated: Aug 5, 2026
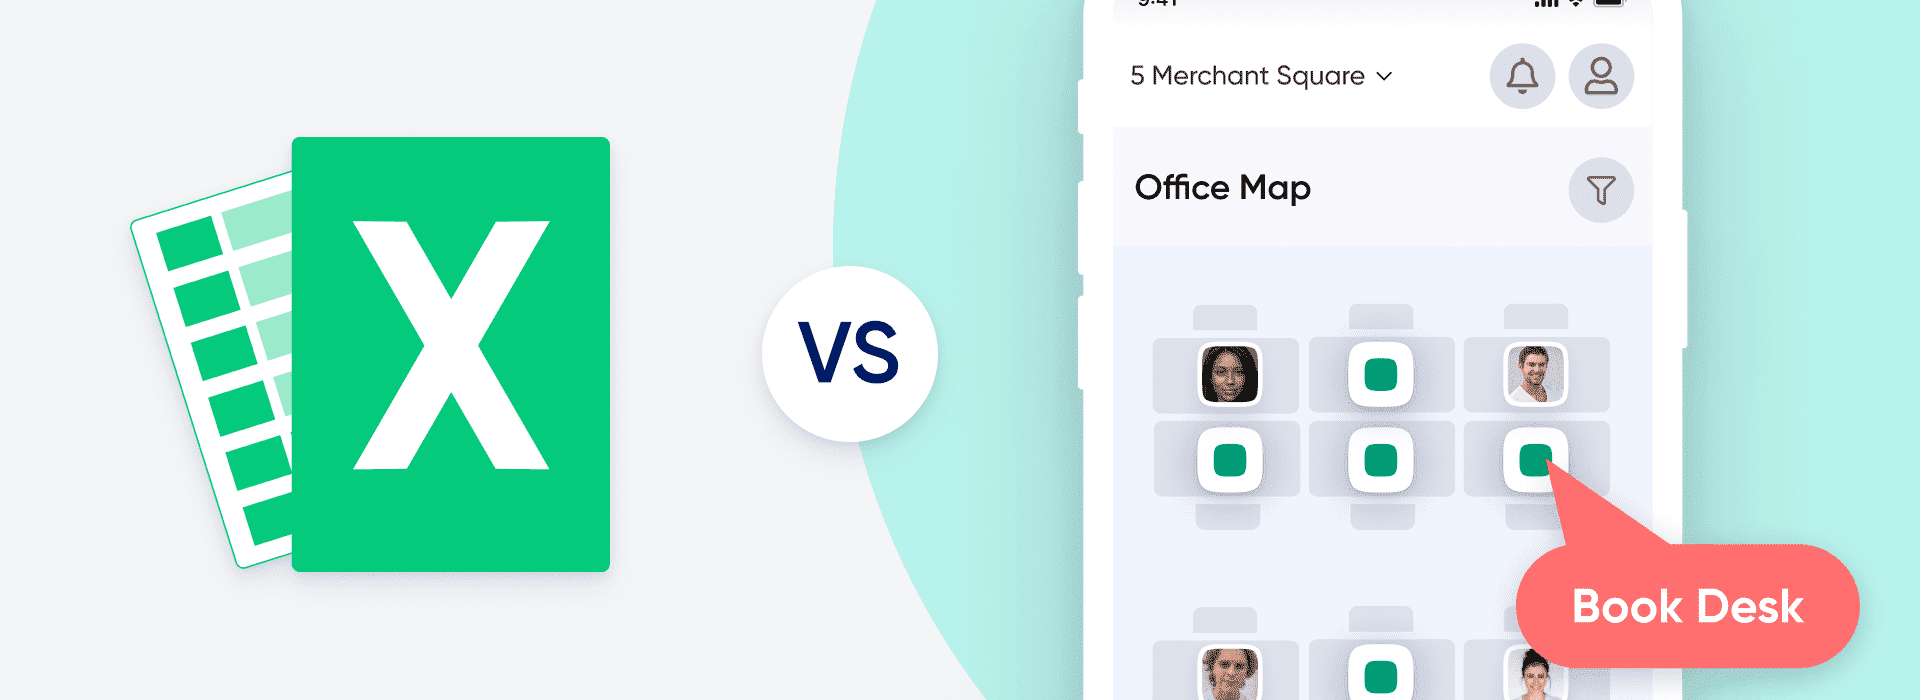
TL;DR:
Most desk booking spreadsheets tell you what people booked. This desk booking template in Excel also tracks who turned up, which is where the difference between a tidy sheet and a useful one sits.
It’s one file, free, and it works in both Excel and Google Sheets. Six tabs: your desks, a 2-week booking grid, a check-in log, a day-by-day floor view, and a dashboard that calculates your utilization and tells you how many desks you actually need.

We built it after looking at 12 months of our own desk data: 12,829 bookings in OfficeRnD’s office, all requiring check-in. What that year showed us is in the second half of this article, so you can hold your own numbers against a real hybrid office.

Six tabs, in the order you’ll use them.
The limits, stated plainly: 30 desks, 40 people, one office, 10 working days at a time. Past that, look at desk booking software instead.
Twenty minutes, start to finish.

In Google Sheets, use File, then Make a copy so it saves to your own Drive. In Excel, download the file and save it to SharePoint or OneDrive if more than one person will edit it.

Open Setup. Type your desk names into the desk table: D1, D2, or whatever your office already calls them. Add a zone (North, Quiet, Focus) and a note about what’s on the desk. Dual monitor, standing, dock. People pick desks on those details, so it’s worth the 5 minutes.
Then add your people. Those names fill the dropdowns on the Bookings tab.
Set “Bookings start” to a Monday. Every date across the grid updates from that one cell.
Set your peak buffer. 15% is a sensible default: it’s the spare capacity you want on your busiest day so that the last 2 people in still find a seat. This number drives the desk recommendation on the Dashboard.
Click any cell in the booking grid and pick a name. Blank means the desk is free.
The next morning, open Check-in and mark who showed up. This is the step people skip, and it’s the step that makes every number on the Dashboard mean something. Ten minutes a day, walked from the door to the far wall.
One person, named, with a backup. Office manager, workplace coordinator or people ops. Their job is to keep the desk list current, record check-ins, and settle clashes.
In Google Sheets, give the owner Editor rights and everyone else Commenter rights if you want bookings requested rather than made directly. In Excel, use SharePoint or OneDrive and skip email attachments entirely. Version control by email is how a booking system dies in week 3.
Six numbers sit across the top. Here’s what a bad one looks like.

Below those, two tables do most of the thinking: utilization day by day, and utilization by weekday averaged across both weeks. The weekday table is the one to screenshot for your leadership team.
We use OfficeRnD Workplace to run our office, so we pulled a full year of data from it. 8 July 2025 to 7 July 2026. 12,829 desk bookings requiring check-in, 8,467 confirmed booking occurrences.
Here’s what to hold your dashboard against.
| Your dashboard says | Our office, one year |
|---|---|
| Average daily utilization | 62.8% (median 66.7%) |
| Peak vs average | 1.9× (Tuesday 71.5%, Friday 37.2%) |
| Days above 80% | About 1 working day in 5 |
| No-show rate | 9.2% of bookings auto-canceled at check-in |
| Booked desk-days released early | 34% |
Monday, Tuesday and Thursday each average 70 to 72%. Wednesday sits at 64%. Friday comes in at 37.2%, barely half of any other weekday.
An office sized for our 63% average would be under pressure every Tuesday and half empty every Friday. Roughly one working day in five goes above 80%, and our busiest days of the year hit full capacity.
This matches what the benchmarks show. CBRE’s 2026 Global Workplace & Occupancy Insights puts global average office utilization at 53% for 2025, up from 38% the year before, with peak utilization averaging 80%. The gap between the two numbers is the entire planning problem.
So when your template’s weekday table shows a 2× spread, that’s normal. Plan for the busy end of it. Our office space calculator works the same way, and there’s more detail in our guide on how much office space you need.
74.6% of our confirmed attendance came from one-off bookings rather than recurring ones. People decide each week whether coming in is worth it, usually because a specific colleague or meeting will be there.
This is why the booking grid needs to be easy to read and easy to change. Recurring patterns cover a quarter of the picture. The rest is people looking at who’s in on Wednesday and deciding on Tuesday night.
Friday produced the strangest finding of the year. It has the highest share of recurring bookings of any day (30%), and it’s also the least reliable day of the week.
39.2% of Friday bookings end up canceled, against 32 to 34% on other days. Friday’s no-show rate is 11%, the highest of the week, compared to 8.2% on Tuesday.
The people who book Fridays are regulars, and they’re the most likely to bail. Standing Friday reservations quietly decay into empty desks. If your check-in tab shows the same thing, you’ve found the day where your booking rules need the most teeth.
Of those 12,829 bookings, 66% were confirmed, 24.8% were canceled by the employee ahead of time, and 9.2% were auto-canceled because nobody checked in.
Read together: a third of booked desk-days went back into the pool before they were wasted, and nearly 1 in 10 bookings would have been a desk sitting empty all day with somebody’s name on it. In our office that’s 4 to 5 desks recovered every working day, or about 8% of daily capacity, from a single policy setting.
Without check-in, our reported utilization would be inflated by desks nobody sat at, and anyone looking for a seat on a busy Tuesday would see a floor plan full of empty “occupied” desks.
Your template can’t auto-release anything. What it can do is show you the size of the problem, so you know what a check-in rule is worth before you go looking for one.
Our hybrid policy asks for 8 office days a month. Against roughly 21 working days, that’s an attendance floor of about 38%.
Friday utilization is 37.2%, sitting almost exactly on the floor. Monday to Thursday averages 69%, which is 1.7 to 1.9× above it.
Everything above the floor is voluntary. People cluster on the days their colleagues are in, and they do it consistently enough that the pattern held across a full year. If you’re writing or revising a policy, our hot desking policy template and our ebook on hybrid work guidelines both cover the mechanics. There’s wider context in our hybrid work statistics roundup.
The Dashboard’s right-sizing block answers this from your own data rather than a rule of thumb.
It takes your busiest day’s demand, adds your peak buffer, and rounds up. Demand uses real check-ins where you recorded them and bookings where you didn’t, so the number gets more honest the more diligent you are with the check-in tab.
Two things worth understanding about it.
Desk sharing ratios have tightened as attendance has recovered. CBRE reports that 48% of organizations now target a sharing ratio between 1.01 and 1.49 people per seat, up sharply from 21% in 2024, and 87% now set explicit utilization targets. If your template suggests something in that range, you’re in step with the market.
Treat the output as a direction. Ten working days is too short a window to sign a lease on, but it’s long enough to know whether you’re 2 desks short or 10 desks over. More ideas on the operational side in our guide to hot desk management.
Rules make the difference between a spreadsheet people trust and one they ignore.
Set the rules once, write them down, and put them somewhere people see them. Policies like these also affect attendance and team productivity more than most managers expect.
Same file, same formulas, and every function in it (COUNTIF, INDEX, SUMPRODUCT, MATCH) works in both. Your desk booking template in Excel behaves identically in Sheets, so choose on how your team works rather than on features.
| Excel | Google Sheets | |
|---|---|---|
| Several people booking at once | Needs SharePoint or OneDrive | Works out of the box |
| Offline access | Yes | No |
| Mobile booking | Workable, not comfortable | Better |
| Calendar | Outlook | Google Calendar |
| Backup and version history | Manual or via OneDrive | Automatic |
| Check-in tracking | Same | Same |
| Utilization dashboard | Same | Same |
This template is honest about its ceiling. Ours covers 365 days and 12,829 bookings. Yours covers 10 working days and whatever somebody remembered to type in.
Signs you’ve reached the limit:
The last one matters more than it sounds. A 2-week sample tells you your week has a shape. It won’t tell you what next year’s floor plan should look like.
There’s one more limit that shows up in bigger companies. When we polled our audience on social media, 11% said they ran desk booking on a spreadsheet and 17.4% had built something in-house.

Around 30% were on desk booking software. The split matters less than what sat behind it: answers from the same company often disagreed, because different teams were running different systems. If your finance team books desks in Outlook and your engineers share a sheet, you don’t have a booking system. You have three, and none of them can tell you how full the office was on Tuesday.
Hybrid working itself has settled into something worth measuring properly. The randomized trial by Bloom, Han and Liang, published in Nature in 2024, found that hybrid work cut quit rates by a third with no drop in performance. That’s a working arrangement to manage well, and managing it well means knowing who’s in the building.
If you want a shortlist, we keep an updated comparison of the best desk booking software.
Every tab in the template exists because software does the same job automatically. Here’s the mapping.
| Template tab | OfficeRnD Workplace |
|---|---|
| Bookings grid | Interactive floor plans with real desks in real positions, bookable from Microsoft Teams and Outlook, Google Calendar or Slack |
| Check-in tab | Automatic check-in, with unclaimed desks released back to the pool |
| Day View | Live view of who’s in, by team and by floor, plus floor plan clustering for larger offices |
| Dashboard | Workplace analytics across months, floors and locations |
| Setup tab | Employee sync from Microsoft Active Directory or Google Workspace Directory |
| The tabs you’d have to build | Meeting rooms, parking and visitors in the same place |
The 34% figure at the top of this article came from one setting: check-in required, auto-cancel on miss. That’s a checkbox in OfficeRnD Workplace’s desk booking functionality and a daily walk around the office in a spreadsheet.


![14 Best Space Management Software Tested and Compared [2026]](data:image/svg+xml;base64,PHN2ZyB2aWV3Qm94PSIwIDAgMTE1MiA3MTkiIHdpZHRoPSIxMTUyIiBoZWlnaHQ9IjcxOSIgeG1sbnM9Imh0dHA6Ly93d3cudzMub3JnLzIwMDAvc3ZnIj48L3N2Zz4=)
The best space management software in 2026 is OfficeRnD Workplace. This is a complete buyer's guide.

The average flex operator connects 1.65 of 5 core systems. See what the gap costs and how to fix it.
A 2-site coworking operator shares how OfficeRnD's AI Sales Agent handles inquiries.
A full year of hybrid work data, taken from our own Workplace product analytics.
OfficeRnD Flex vs Nexudus on pricing, features, and real G2 reviews.
OfficeRnD Workplace vs Robin, full comparison: pricing, adoption, coordination and fit